visit project 

project
10/04/2013 – 20/05/2013
FH Potsdam
meteorites
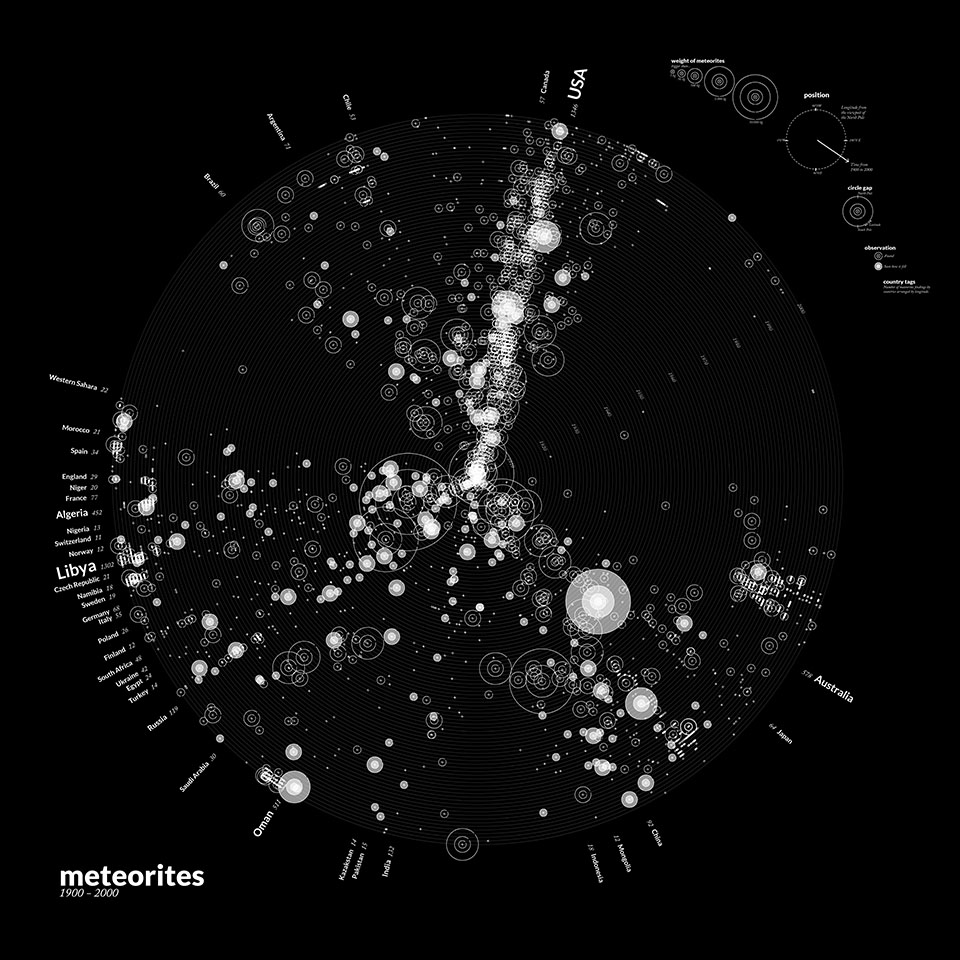
Visualisation of all fell and found meteorites between 1900 & 2000. The graphic gives a special view on meteorite findings by comparing time and longitude on a radial axis. This kind of visualisation shows the human bias on the physical locations of found meteorites. For example there are two big holes on the longitude of the Atlantic and the Pacific Oceans. It shows how the USA are constantly searching for meteorites over the last 100 years. The strategic searches in Libya the North and South Pole over the last 20 years show up as clusters. And there is more to find.